Returns Data
Part of Returns data and root-cause analysis
Comparing return rates across product variants
Compare physical return rates by variant with clear counts, a consistent denominator and enough time for returns to arrive.
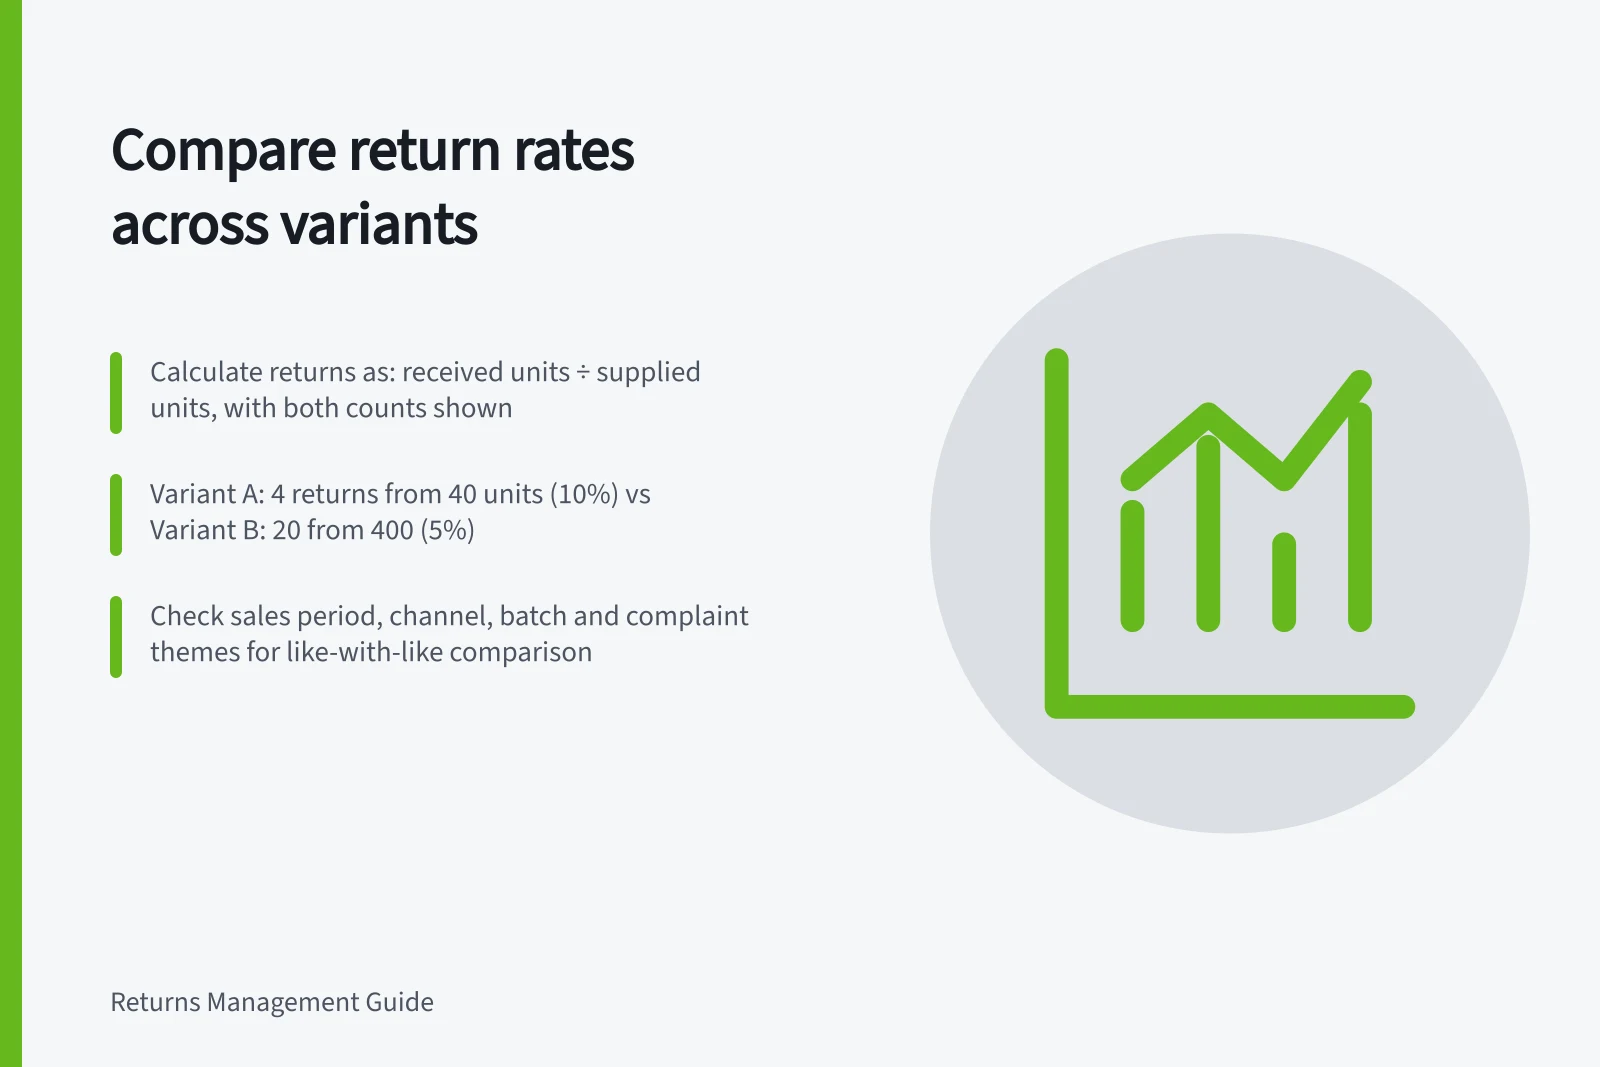
For a receipt-based comparison, calculate units physically received back from a defined sales group ÷ units supplied to customers in that group. Show both counts beside the percentage. A high rate from only a few returned units calls for case review before ranking variants or claiming a defect.
Define the sales group
Choose the product, stable variant identifier and order-date range. Count units supplied, including those not returned, and link each returned unit to its original order line. Exclude cancelled or unfulfilled units from this suggested denominator. Keep pending requests and refunds without returned items in separate measures.
Sales reports may include adjustments such as edits, exchanges or returns made after an order is created. Check what a report includes before comparing it with a receipt-based calculation.
Recent orders have had less time to produce returns. Compare order groups only after each has had a similar follow-up period, and state how late returns are handled.
Show the arithmetic and the cases
In an illustrative example, Variant A has 4 received returns from 40 supplied units, or 10%. Variant B has 20 from 400, or 5%. A has the higher observed rate, but its four cases and smaller sales group need review before action.
For each variant, show supplied units, received returns, observed rate and the main complaint themes. Use a stable identifier alongside the display name. Names, sizes or colours may change; relying on labels alone can split or merge historical rows. Check for deleted or retired variants before treating an export as a complete history.
Compare like with like
Check whether variants were sold in similar periods, channels and promotions and whether they came from comparable batches. A newly introduced or frequently unavailable option may attract a different group of buyers from a long-running one.
Read the cases behind the higher rate. Complaints about one measurement point call for a different investigation from returns with unrelated reasons. Compare the targeted complaint rate as well as the overall physical return rate. Report the observed counts and rates; evidence about the item, listing or fulfilment is needed before naming a cause.