Returns Data
Part of Returns costs and profitability
Calculating cost per completed return
Define completed cases, match handling costs to them and calculate a return-cost average without mixing refunds, stock value or open work.
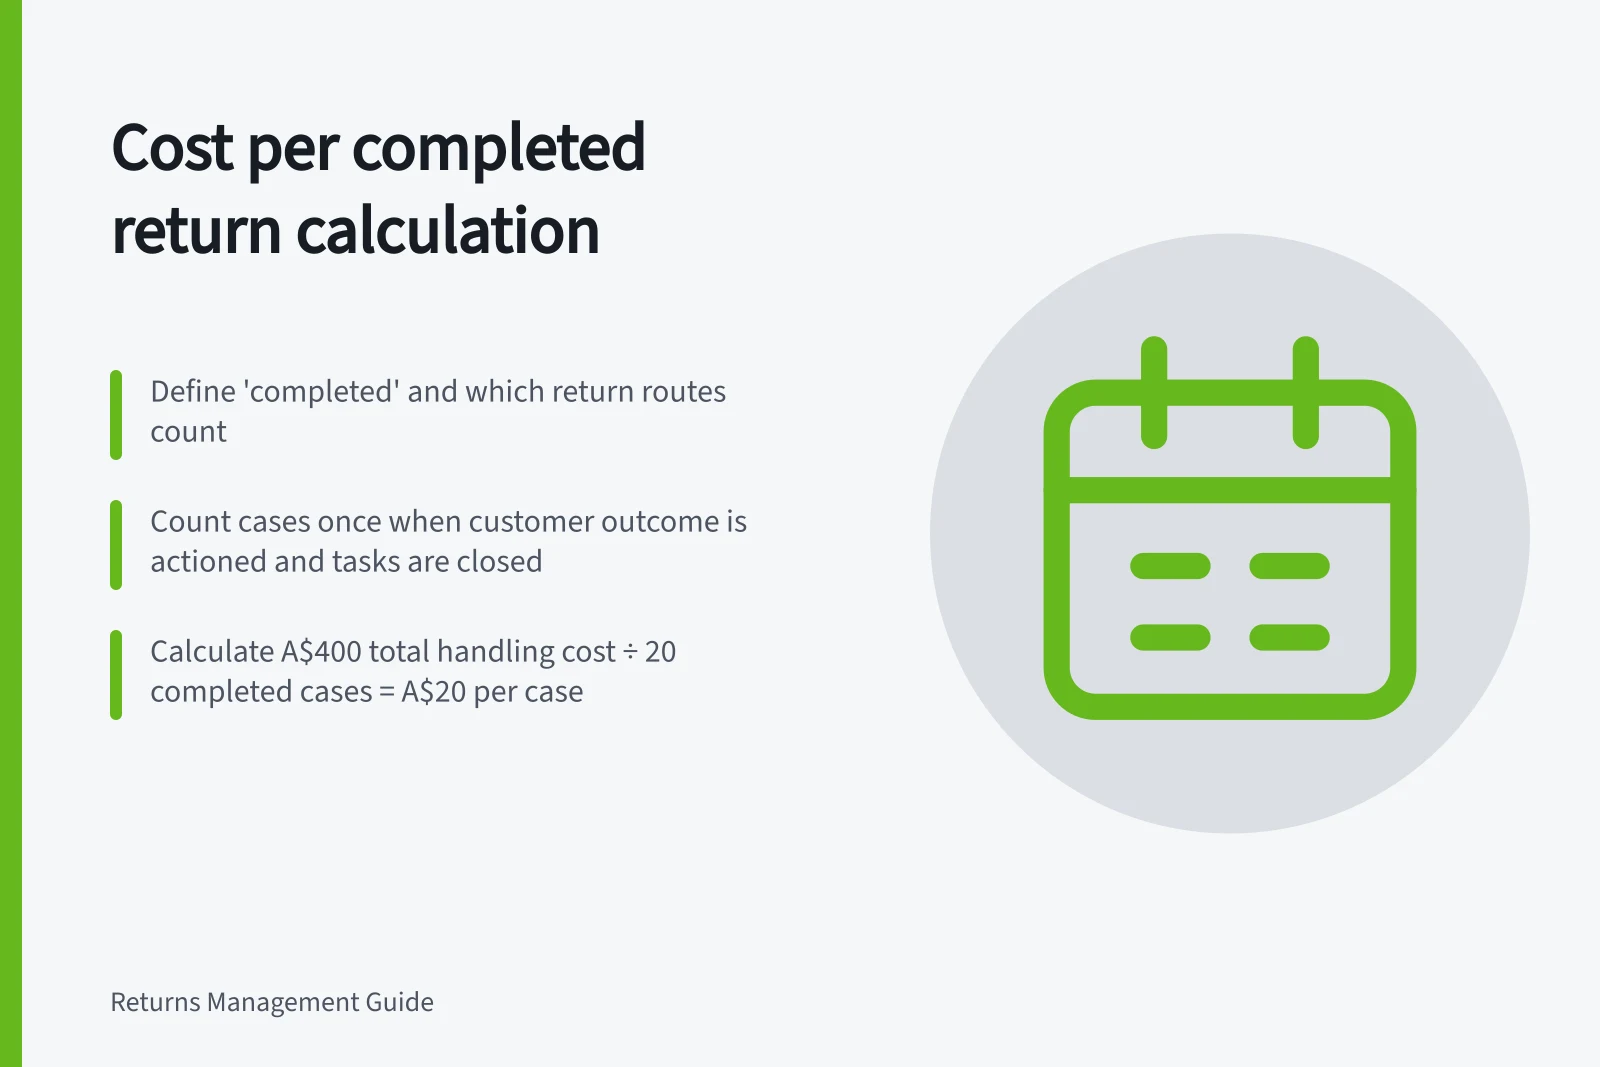
Calculate cost per completed return as handling costs matched to a defined group of completed cases ÷ the number of cases in that group. Before collecting costs, define “completed” and which return routes count. Without those definitions, the average can mix invoices, parcels, refunds and open work from different periods.
Set the denominator
For a case-based measure, count a case once when its customer outcome is actioned and its return tasks have a recorded end state. This is a reporting definition; it must not delay a customer remedy while a separate stock task remains open. Two items in one parcel can still be one customer case, with item-specific costs recorded where needed.
Decide whether the report covers physical returns or all resolved return cases. A refund without an inbound item belongs only in the broader measure; show that route separately. For physical returns, state whether a lost parcel resolved without receipt is included, and keep that rule consistent.
Choose a cohort, such as cases completed in a calendar month. Where possible, match postage and other charges to those cases by case ID. Invoice, parcel and case-close dates may differ. If a shared charge must be allocated, record the basis rather than assigning it silently to the invoice month.
Build the numerator once
Core handling costs may include retailer-funded return freight or collection, reasonable postage reimbursed to customers, consumables, incremental processing charges, and staff time for receiving, assessment and resolution. Use actual charges where available. For estimated labour, retain task times and the rate used so periods remain comparable.
Keep these outside the core handling average unless a wider measure is clearly defined:
- Refunded sale value:treat it in the product outcome calculation, not as an extra handling expense.
- Returned item value:assess recovery separately; an uninspected item has no confirmed resale outcome.
- Original outbound selling costs:include them in a product contribution model if relevant, without counting them again here.
- Shared software and fixed overhead:use a separately labelled allocated measure when it helps a decision, with the allocation method stated.
Check payment and processing fees carefully: a charge incurred on the original sale and an additional return charge are different costs. Assign each charge to one measure, or identify it explicitly when two reports present different views of the same case.
Include transport costs in the measure when incurred, and record which party paid them.
Work the calculation
Suppose 20 hypothetical physical-return cases completed in a period. Costs matched to those cases are A$240 for return freight and reimbursements, A$120 for handling labour and A$40 for packaging and extra processing. Total handling cost is A$400, so A$400 ÷ 20 = A$20 per completed physical-return case. These invented figures demonstrate the formula; they are not a benchmark.
Show the case count and total next to the average. One bulky collection can materially affect a small group. Separate meaningful routes and read the cases behind an unusual result before treating the mean as a trend.
Reconcile before comparing periods
Check case charges against carrier invoices, staff records and payment adjustments. Look for open cases in the numerator, duplicate label charges, and multi-item parcels whose freight was assigned in full to every item. Mark missing invoices and estimates instead of treating them as zero.
Compare the same definition over time, with completion time, open cases and repeat contacts beside the average. A lower figure may reflect improved handling, a different mix of products or work left unfinished. Product contribution requires a separate calculation.